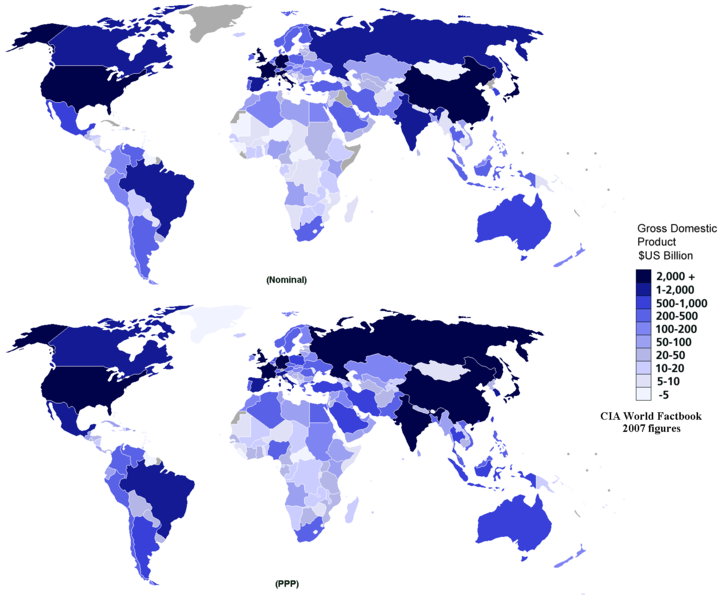
There are two methods of GDP calculation: nominal GDP attempts to compare countries using current exchange rates to give an assessment of their clout within the global market. Purchasing Power Parity or PPP GDP, on the other hand, tries to take into account that one dollar can buy more in some countries and less in others. It is a better gauge of the internal size of each market.
In the nominal GDP method, we can see that the developed world leads the pack, but that China has already broken into this exclusive club.
When we look at PPP GDP, China, India, Brazil and Russia are all within the top 10.
Here is the Top 10, as listed by PPP GDP:
| Ranking | Country | Approximate GDP- Purchasing Power Parity |
| 1 | United States of America | $13,860,000,000,000 |
| 2 | China | $7,043,000,000,000 |
| 3 | Japan | $4,305,000,000,000 |
| 4 | India | $2,965,000,000,000 |
| 5 | Germany | $2,833,000,000,000 |
| 6 | United Kingdom | $2,147,000,000,000 |
| 7 | Russia | $2,076,000,000,000 |
| 8 | France | $2,067,000,000,000 |
| 9 | Brazil | $1,838,000,000,000 |
| 10 | Italy | $1,800,000,000,000 |
This map from the CIA World Factbook will help to illustrate the differences between calculating world GDP figures on a PPP or nominal basis.
For an analysis on nominal GDP comparisons read our article on World GDP.
A sectoral analysis of country GDP allows us to understand the paradigm shift now occurring within most world economies. Growth patterns generally show a shift from agriculture to manufacturing and ultimately to the services sector.
The following table shows the percentage of GDP contributed by each sector in the top ten economies of the world:
| Country | Contribution of Services Sector in GDP (estimated for 2007) | Contribution of Industrial Sector in GDP | Contribution of Agricultural Sector in GDP |
| United States of America | 78.5% | 20.6% | 0.9% |
| China | 39.5% | 49.5% | 11% |
| Japan | 73.3% | 25.2% | 1.5% |
| India | 55% | 28.4% | 16.6% |
| Germany | 69.5% | 26.9% | 0.9% |
| United Kingdom | 75.5% | 23.6% | 0.9% |
| Russia | 56.3% | 39.1% | 4.6% |
| France | 77.3% | 20.7% | 2% |
| Brazil | 64% | 30.8% | 5.1% |
| Italy | 69.3% | 32% | 5% |
The growth rate of these economies is also an important factor, and is directly related to the overall development of a specific economy. Group of Seven Countries such as the United States, France, Italy and the United Kingdom all typically have smaller growth rates – usually in the region of about 2% per annum.
By contrast, emerging economies such as India and China have growth rates of around 8% to 11%, while the ‘new’ emerging economies may experience even more blistering growth rates. Developed countries have already reached a saturation point, and thus expand less than emerging economies, where possibilities and opportunities are ripe, investors are ready to take risks, and consumers are demanding more goods and services than ever before.
Visitors till this post: 22398 visitors


No comments:
Post a Comment